The WEB is no longer reserved for large accounts. The technical means and the costs of the solutions are no longer an obstacle for everyone to publish on the WEB their data and maps. But this development has gone hand in hand with a multiplication of technical solutions and the main obstacle, today, is to choose the best solution to one’s needs. We will discuss here a rather general overview, but which, I hope, will help you to make a suitable choice.
Maps and / or data?
The first question is, always, WHAT? What do you want to publish? You can stream maps, ie the equivalent of what you see in your QGis interface on the computer. The user retrieves the URL of your map and he finds a simplified GIS interface and a map formatted by you. He can zoom, display or cancel the different layers but he does not have direct access to your data. You publish the result of your work, not the means you have used.
You can, also, choose to put on line your data, i.e. to render accessible data layers, without any special format. In this case, the user will perform a WFS or WMS connection to your data and he will be able to integrate it into his own projects by coupling it with his own data.
According to the tools selected, you can do either one or both.
Quantity?
The second question is HOW MANY? Without trying to predict the exact megaoctet, you need to know in advance whether you want to share your raster data or not. If you restrict yourself to the vector data, then your data volumes will, in principle,be well below the limits of the proposed tools. On the other side, if you work with raster data (images, mnt , etc) you will exceed these limits from the very beginning.
Investment?
The cost of the chosen solution is not limited to the software or hosting costs. The main cost will be your time. Let’s assume that you already know QGis. You have already solve where to put on line your maps and / or data by using a plugin in QGis . You will, also, have other solutions that imply an investment in time and effort to learn how to use other software. Some solutions will work on your computer, others will require to install a Web server. If your world is limited to Windows, you are likely to have to use Linux.
So try to stay as close as possible to your needs.
Putting your data on line.
Putting your geographic data on line is performed through the so called WFS or WMS streams. These two strange terms simply refer to two standard data exchange protocols. The first, WFS, is the vector data? The second, WMS refers to raster data but also to the vector data vector displayed as images ( similar to sending a copy of your vector layers by using a screen shot).
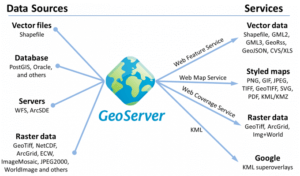
Geoserver
All the solutions regarding QGis that we will address here allow to make your WMS and WFS fluxes of your data available to the WEB. But if you have a WEB server the best solution is to put in place Geoserver. This is an Open Source software, free, powerful and very, it will be a good investment. For basic use, you won’t need more than one day to install, configure and start putting in place your data feeds.
You can to put on line shapefile layers but if you truly want to harness the power of Geoserver it is advisable to couple it with PostgreSQL / Postgis .
For more information on this solution, I invite you to read the article “ Start with Geoserver “ .
Putting on line your maps and data
QGis Cloud

QGis Cloud is a QGis plugin associated with a cloud service. The plugin allows you to load your QGis project in the cloud, load your data on a cloud basis and to get in return a URL which allows you to visualize your map with a simplified interface GIS and a URL to access the WMS feed of your data. Therefore the map is accessible with a simple WEB browser and, by default , the public can connect to the Cloud WMS stream to integrate your data in their own projects .
With some very simple adjustments, you can put on line your vector layers (WFS) and, even, allow users to update the data (WFS-T).
You do not have to take care of server side by adopting this solution. QGis Cloud manages the databases and online setting tools of the map.
So much for now. Now, what are the disadvantages of this option? First of all the data volumes. If you are using the free option, your project cannot exceed 50MB.Therefore you cannot include raster layers in your project. This does not apply to a raster base map like Goggle Satellite, OSM, Bing, etc. because QGis Cloud allows you to define one of these sources as a base map excluding its data volume (the map is not loaded into your database).
Nevertheless you can upgrade to the paid option (fee) and you will be entitled to 500Mo for a price of 65 € / month , and you have the possibility of adding 20 € / month per gigabyte additional .
But if you add the cost of hosting a server complete , at OVH for example , which runs for a Pro option with 250 GB for less than 10 € per month , let’s be honest , this solution is valid, only, for projects relatively small or for those who prefer to pay a lot for an easy solution instead of investing in the management of a server , because all the solutions that follow involve setting up a server.
For more information on this solution, I invite you to read the article Submit your QGis maps on the web with QGis Cloud .
QGis server

This is the server version of the QGis project. You will need a physical server and set on this Apache 2.4 server ( minimum versions ), PHP 5.5, and PostgresSQL 9.3, before installing the QGis Server.
The principle is simple (even if installation can, suddenly, become a nightmare): you create your project using QGis Desktop, you transfer your data and project on your server, and then, you set up manually the online setting of your project by modifying the PostgreSQL database tables of QGis Server administration.
The user can access your map as well as the WFS and WMS streams. With this solution you surmount the data volume problem.
The interface in the browser is a simplified GIS interface (zoom, measurement , display of attributes ).
For more information about QGis Server, see you to the article Install QGis Server on Windows 10
Putting on line your maps
QGis2Web

With this solution you have the opportunity to put on line your maps but not the WFS and WMS streams.
QGis2WXeb is a QGis Desktop plugin. This plugin allows you to export your QGis local project on a classic HTML server . No particular software is needed in the server .
The map will use a LeafLet code or OpenLayers , optionally , contained in an HTML page. Your data will included a data with a file GeoJSON format. Just copy on your server the html page and the json file for your map to be in line .
The big advantage is that nothing has to be added to the server. Another advantage is that this solution is an easy first step to address the last of the options we will see afterwards. In fact , the generation of the OpenLayers or Leaflet code can be used as a basis for developing pages with much richer functionality.
The main disadvantage is the absence of WFS or WMS stream and the fact that freezes the data while copying it whenever they are being used in a project .
For more information on QGis2Web, see you to the article How to export your QGis project in html page in two clicks : Qgis2Leaf.
And if you must go further
If your needs exceed what has been discussed so far , you must consider leaving aside QGis as the basis of your mapping on the WEB. Several architectures are available. For a start, you can start with Postgres / Geoserver / OpenLayers . In any case architecture will include necessarily :
- a database management system (Postgresql, Oracle …)
- a data server (WFS, WMS, …)
- a language to write HTML pages for the interface cartographic ( LeafLet, OpenLayers , … )
You will find an example of how to develop a Webmapping application (search a route ), from the database to the HTML page, in the following articles Develop an application with pgroutingon Windows (1 at 7)
Great article to help decide what solution works best for your online GIS needs.