Building an interactive dashboard in QGIS: dynamic analysis with Data Plotly, widgets and expressions
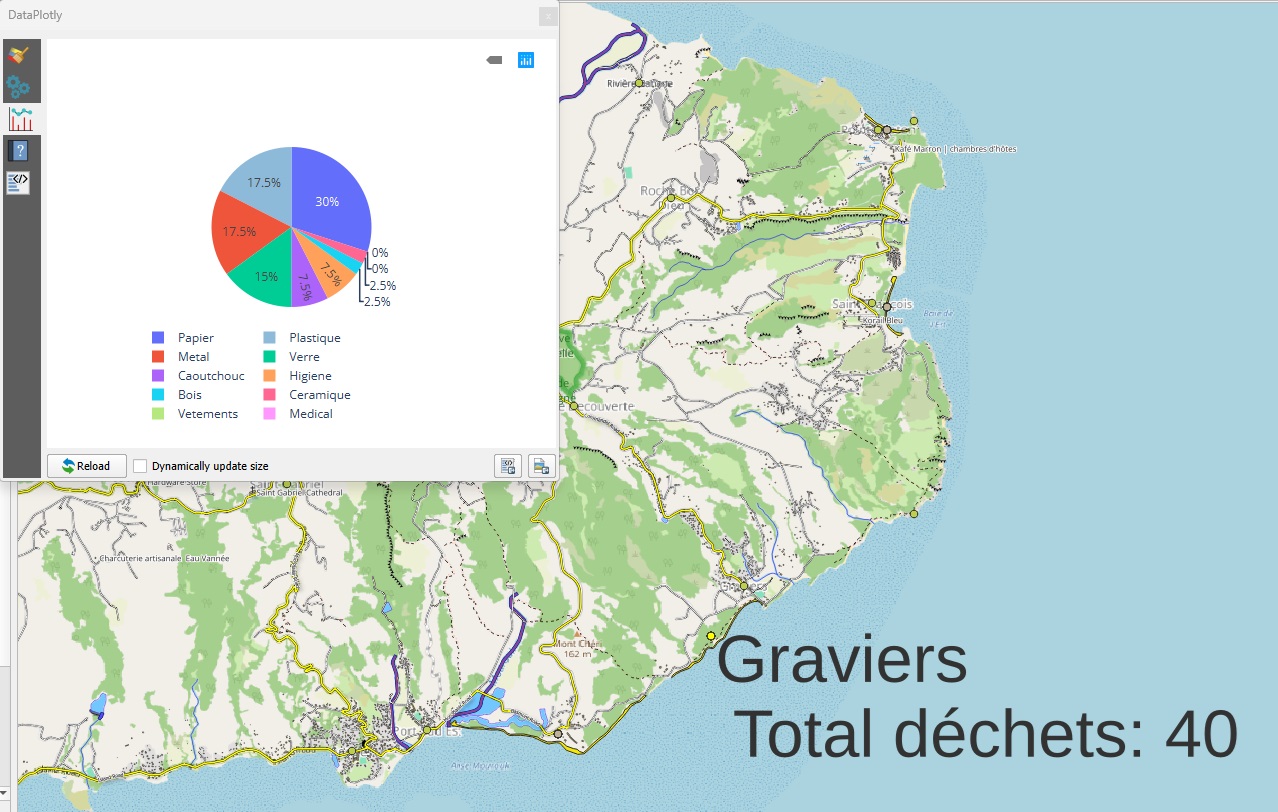
Objective Create a dynamic monitoring interface in QGIS with : All without leaving the QGIS interface! Use case: monitoring beach litter Let’s take our releves_dechets layer with : Field Description beach Name of beach type_waste Waste…
Read More