We will devote some articles to this ArcGis application for those who want explore it or start a true project .
Most of ArcGis Pro deals with projects where coexist 2D-3D. Except for the ArcScene followers, most ArcMap users are confined to 2D views , even when they work with data in excess of 2 dimensions such as the NCDs.
We have already published a series of articles that address the topic of how to convert 2d data to 3D data:
How to transfer your data from 2D to 3D to fully exploit ArcGis Pro 1.0? 1 – 1-With Interpolate a form
2-With 3D layer to entity classes
3 – Your 2D to 2.5D rasters ( functional surfaces )
5-How to create 3D raster surfaces
6-How to create 3D vector surfaces
Now we are going to consider an example and follow the procedure with ArcGis Pro. We will use the data and example from the article3D – Functional surfaces – Coastal specific case (sea-land interface), since it, also, allows to consider the basic working methods with ArcGis Pro.
Example details
We have two data sources to generate our DEM:
an SRTM raster for the terrestrial area

and an isobaths layer for the marine section .

We have a Bing aerial image for the Conquet area that we want to see in 3D, draped over our DTM

Then, we will build a continuous land-sea DTM with ArcGis Pro.
How to define the earth and sea domains
Being given that we have different sources and processing for the data located on earth or in sea, a prerequisite is to define the boundaries between the two domains .
To this end, we will use a classic layer (Coastline common IGN-SHOM) and a surface rectangle of our study area .
- Open ArcGis Pro and select a Local Scene type new project.
ArcGis Pro opens with a 3D view and a default layer (Topographic)
- Click the Insert tab and the button NewMap
The 2D view is added to the map.
You can remove the Topographic layer
Load you 2D layers in the 2D view : Map tab , Add Data button
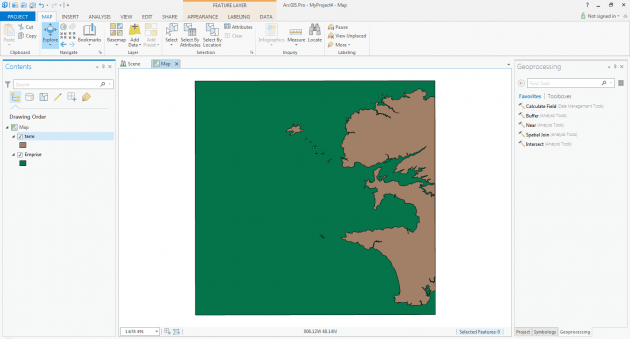
You can see that the window has 4 different areas :
- at the top: the ribbon with menus and command buttons
- left: the legend window, similar to ArcMap
- center: the view window with a tab for each available view
- right: the geoprocesseur window
We will carry out a simple task : create a polygons layer with terrestrial
and marine polygons.
We have a terrestrial layer and a delimiting rectangle. If we perform the union
of these two layers, we will create one or various polygons Additional terrestrial
polygons fill the surface. These new polygons will correspond to the sea.
In order to perform this operation , we must find the Union tool in the
Toolbox and execute it .
In the Geoprocessing window , click Toolboxes (
next to Favorites )
You can see the classic Toolbox window of ArcMap .

Will continue…