Portable version of QGis 3.44.0
You can download a portable version of QGis 3.44.0 from this link The compressed file is 1.2 GB. Once decompressed, it will occupy 2.91 GB on disk. What is a portable application? A portable application (or…
Read MoreGIS coaching for territorial management.
You can download a portable version of QGis 3.44.0 from this link The compressed file is 1.2 GB. Once decompressed, it will occupy 2.91 GB on disk. What is a portable application? A portable application (or…
Read More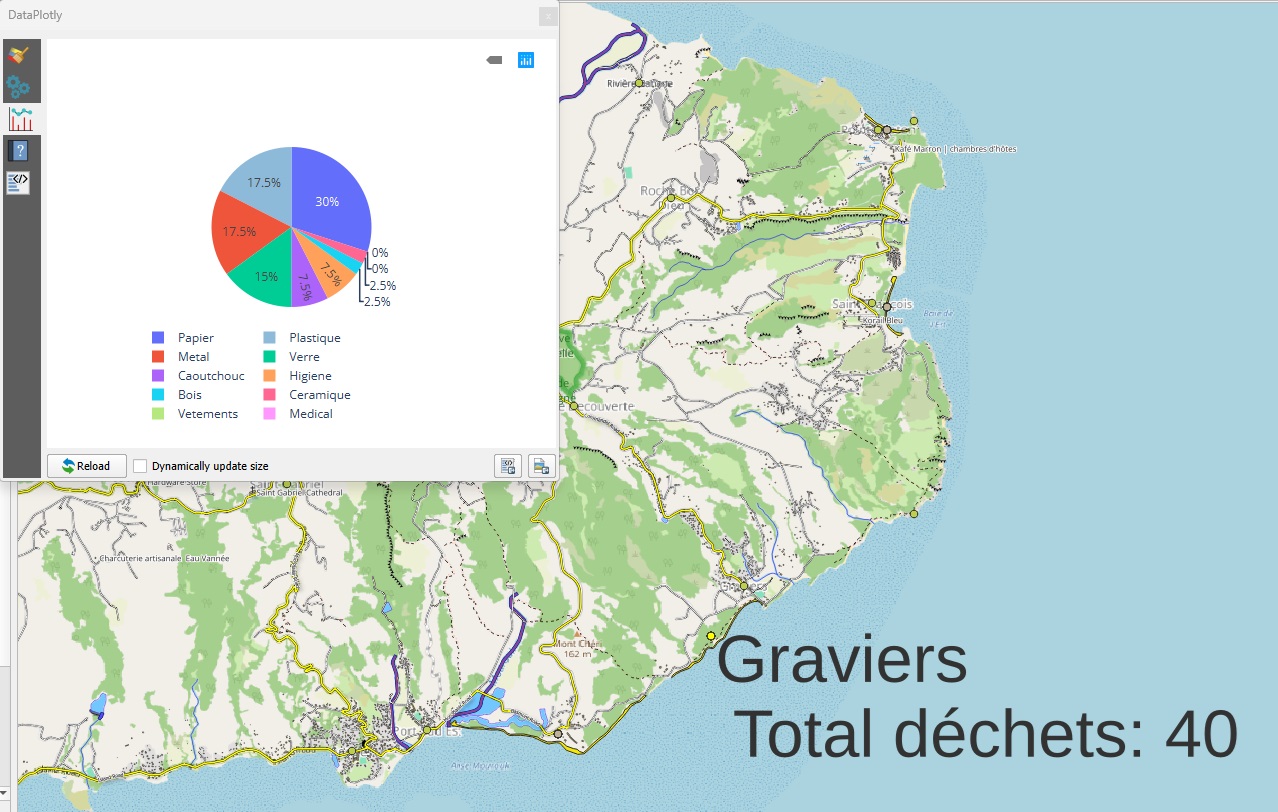
Objective Create a dynamic monitoring interface in QGIS with : All without leaving the QGIS interface! Use case: monitoring beach litter Let’s take our releves_dechets layer with : Field Description beach Name of beach type_waste Waste…
Read More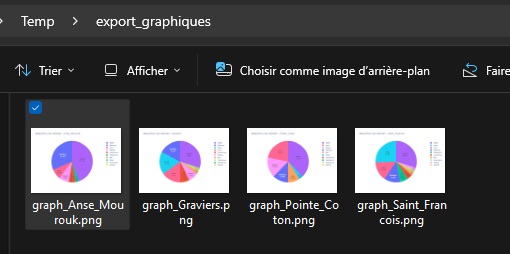
In our previous articles, we looked at how to create graphs in QGIS with Data Plotly. Today, we’re going one step further: automate the generation of a graph by range (or any other entity), exporting the…
Read More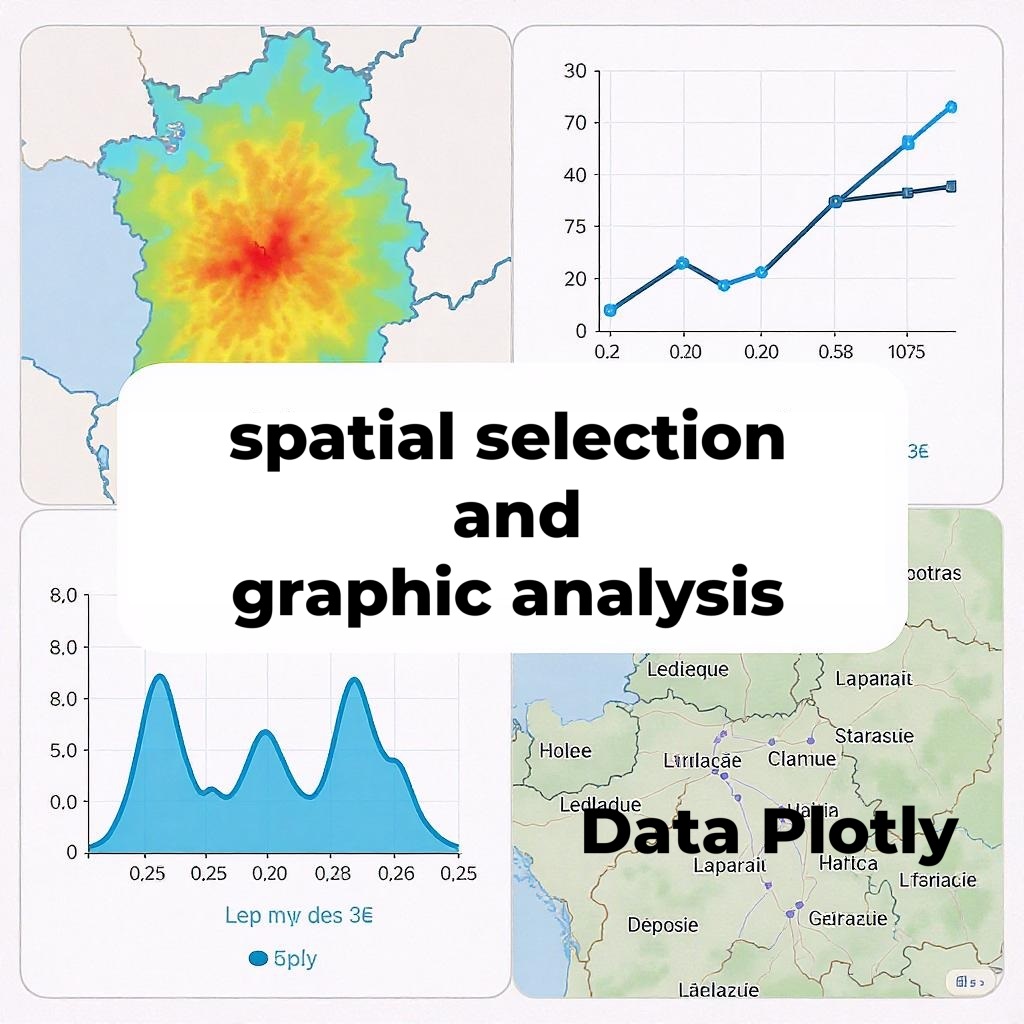
In our previous article, we discovered how to use the Data Plotly plugin to create graphs directly in QGIS. Today, let’s go a step further and learn how to dynamically filter the data displayed in graphs,…
Read More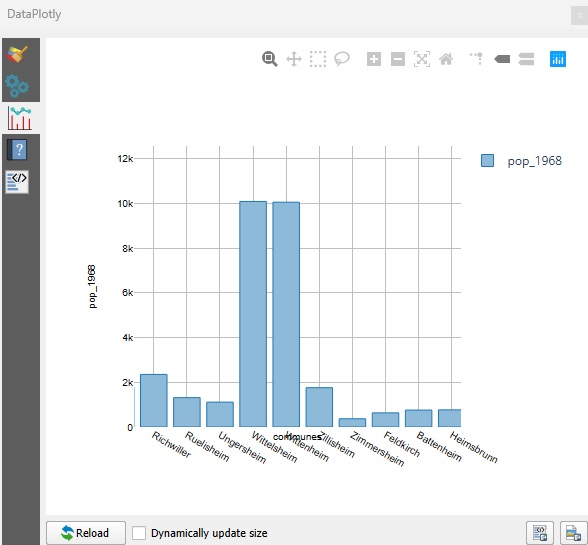
QGIS is a powerful Geographic Information System (GIS) software, renowned for its modularity thanks to its numerous plugins. Among these, Data Plotly stands out for its ability to create interactive graphics directly from GIS layers. A…
Read More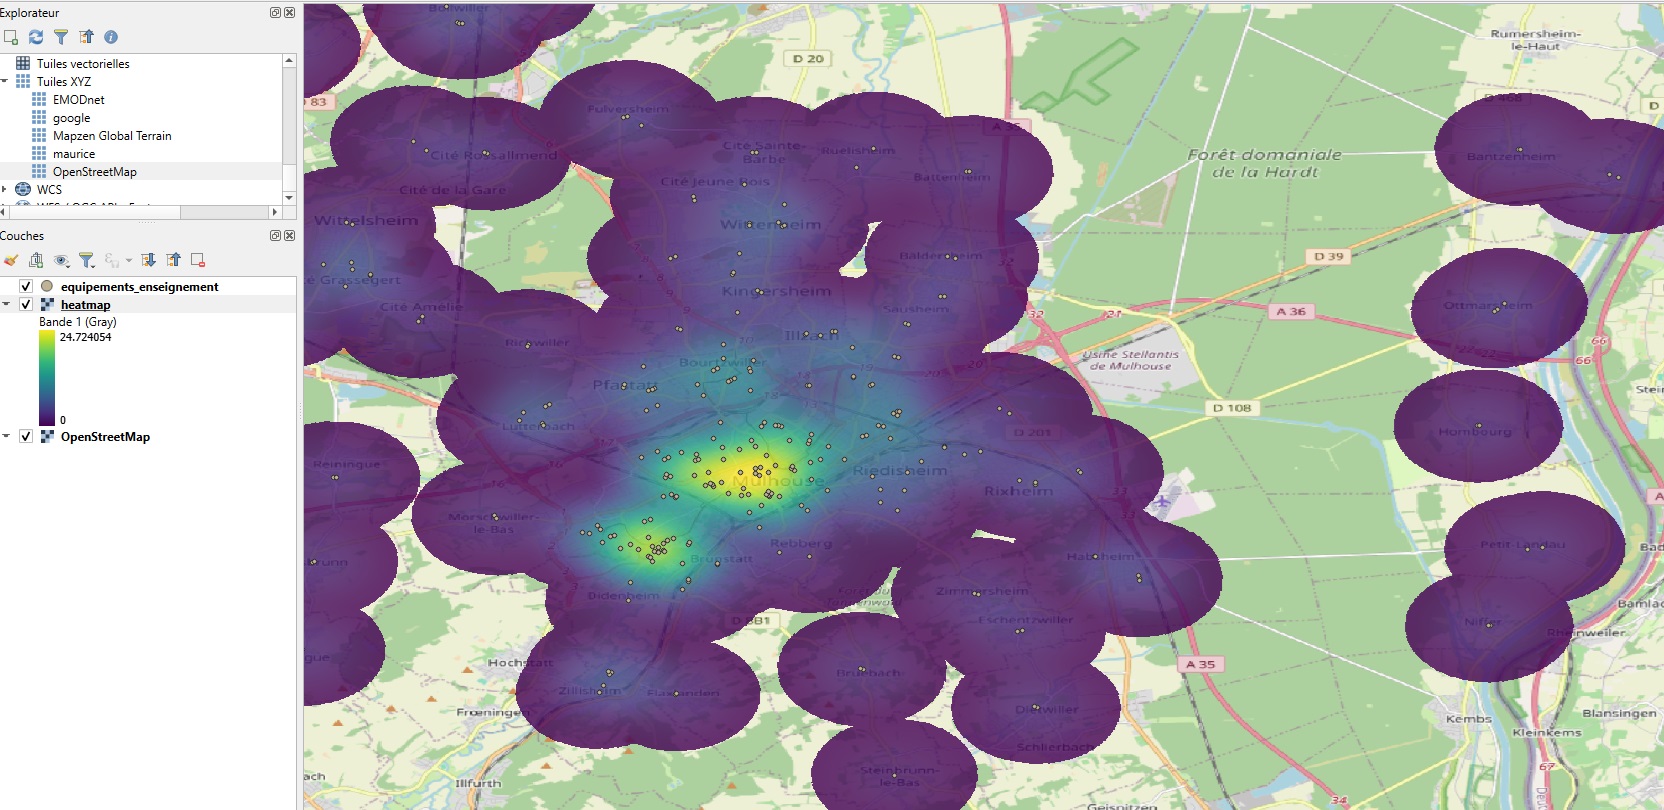
Heatmaps and hotspot maps in QGIS: understanding the differences In spatial analysis, heatmaps and hotspot maps are two powerful techniques for revealing concentrations or areas of interest from geographic data. While their appearance may be similar…
Read More